The 2026 US-Israel-Iran War (Primary Shock)
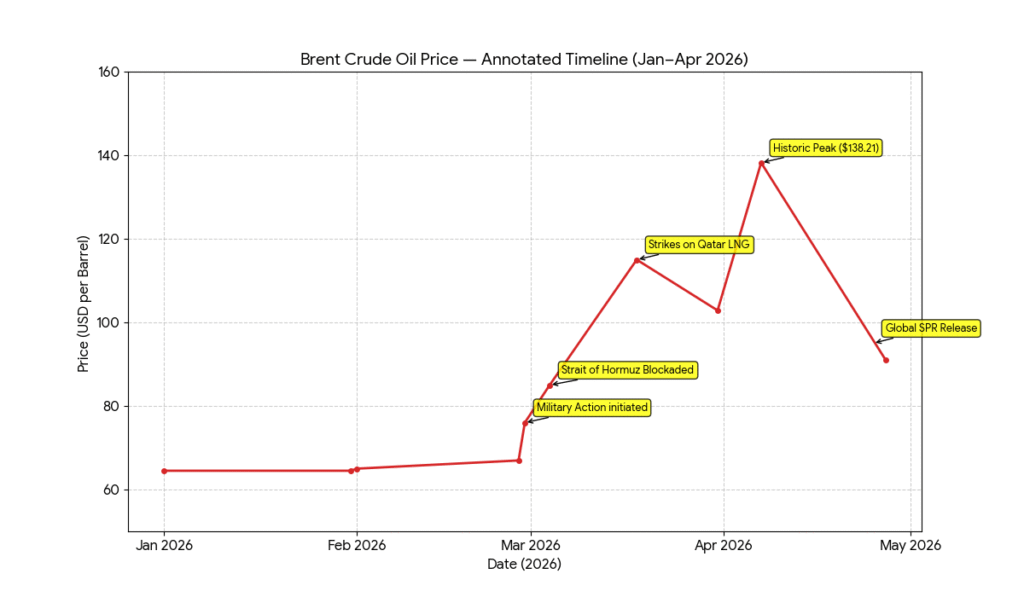
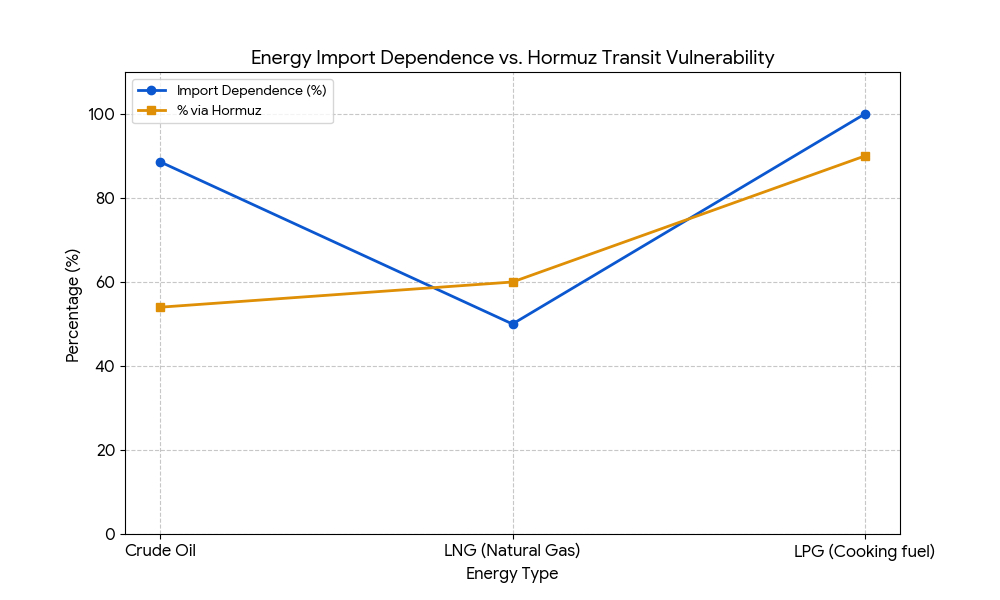
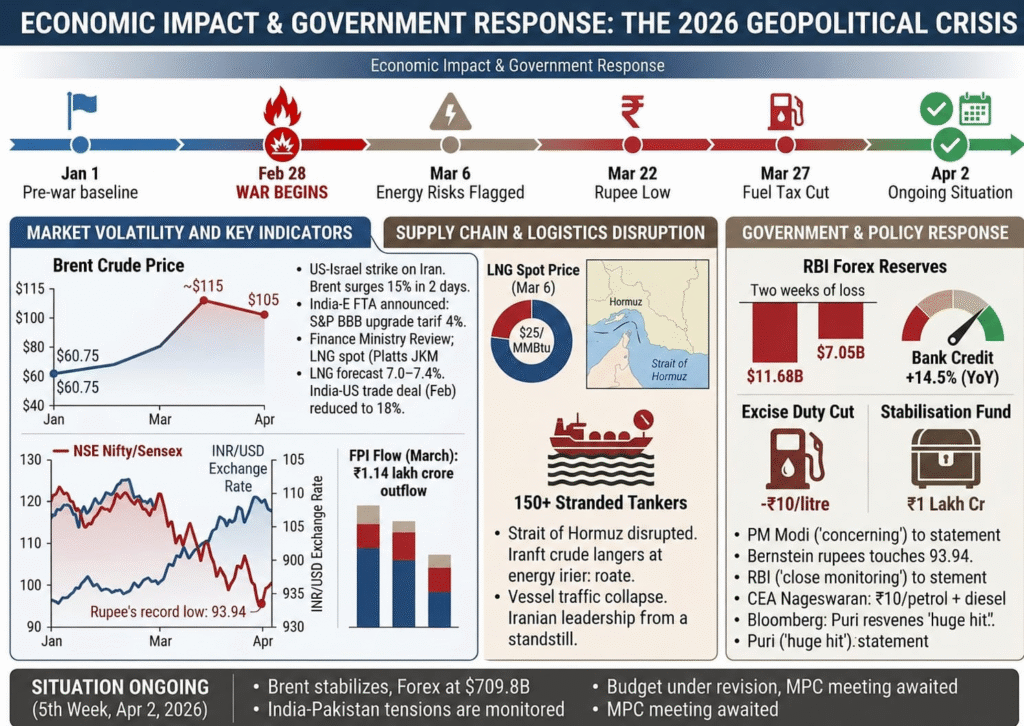
The 2026 US-Israel military campaign against Iran, launched February 28, is the dominant external crisis for India. US and Israeli forces struck Iranian nuclear and military sites, killing Iran’s top defence leadership. Iran retaliated with 2,100+ missiles at US bases, Israeli and Gulf targets. The Strait of Hormuz – through which 20% of global oil and 17% of global LNG flows – has been weaponised, with vessel traffic collapsing from 200-300/week to just 1/week. The IEA declared this ‘the greatest global energy security challenge in history.
India-Pakistan Tensions (Secondary Risk)
Post the Pahalgam terror attack (April 22, 2025), India-Pakistan tensions escalated – India suspended trade, downgraded diplomatic relations, and took punitive action. Moody’s warned the conflict poses increased risks to both nations’ credit metrics. A 42-day India-Pakistan conflict is estimated to cost India 49,000 crore (~7% ₹ of its defence budget).
US-China Trade War Spillover
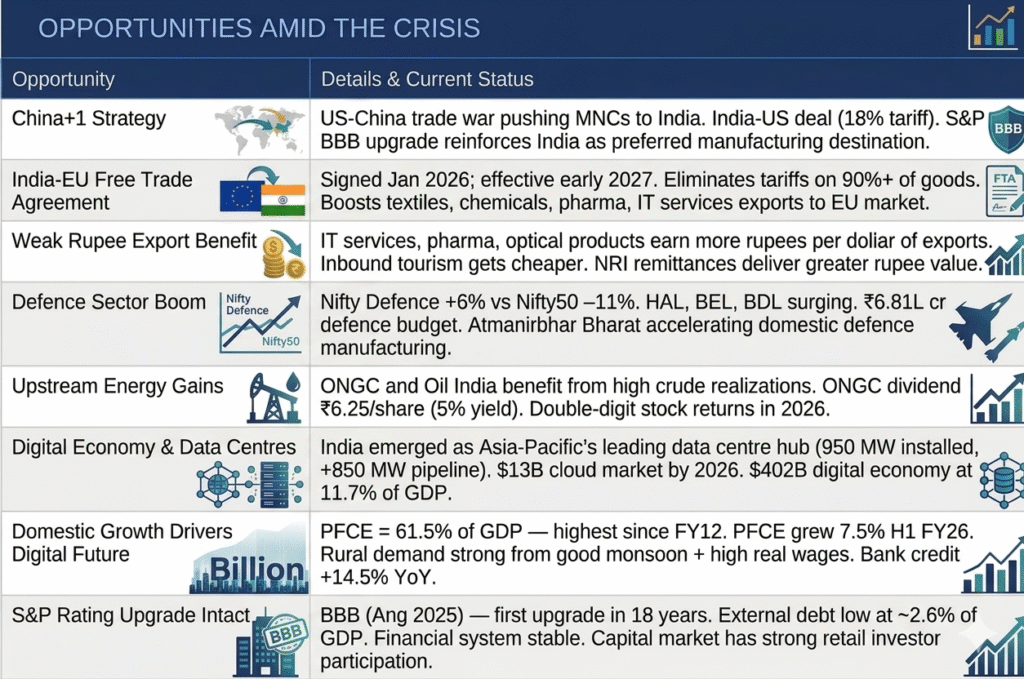
US-China tariff escalation creates both risks (Chinese goods dumping) and opportunities (China+1) for India. The India-US trade deal (Feb 2026; tariffs cut to 18%) and India-EU FTA (Jan 2026; effective 2027) are counterweights providing structural long-term support.
ENERGY SECURITY & OIL SHOCK
India’s Energy Vulnerability
India imported 88.6% of its crude oil during Apr–Jan FY26. Of this, 46.9% came from West Asia. The Strait of Hormuz disruption therefore hits India at its most vulnerable structural point.
Crude Oil Price Surge — Charts & Impact
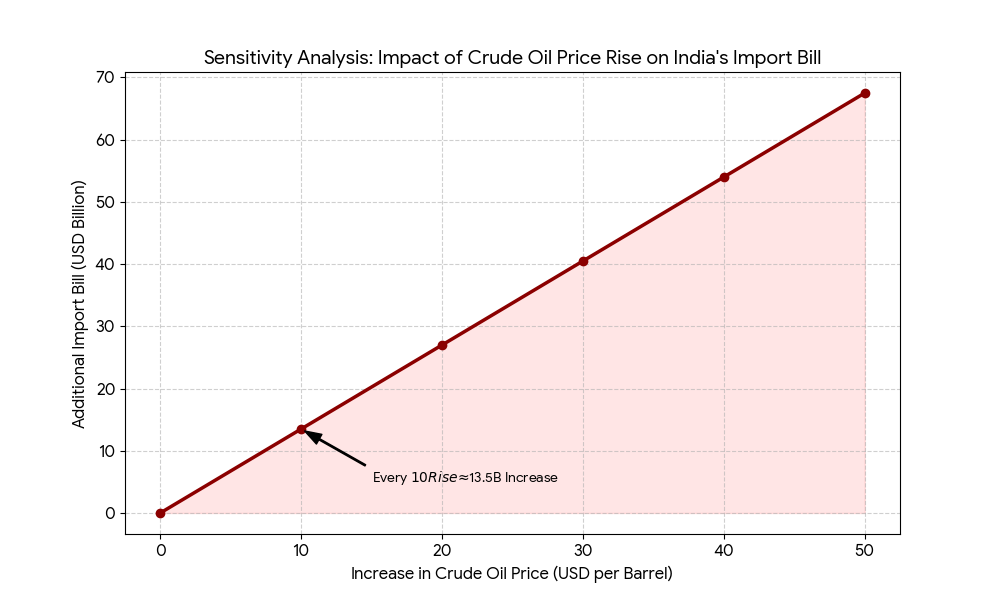
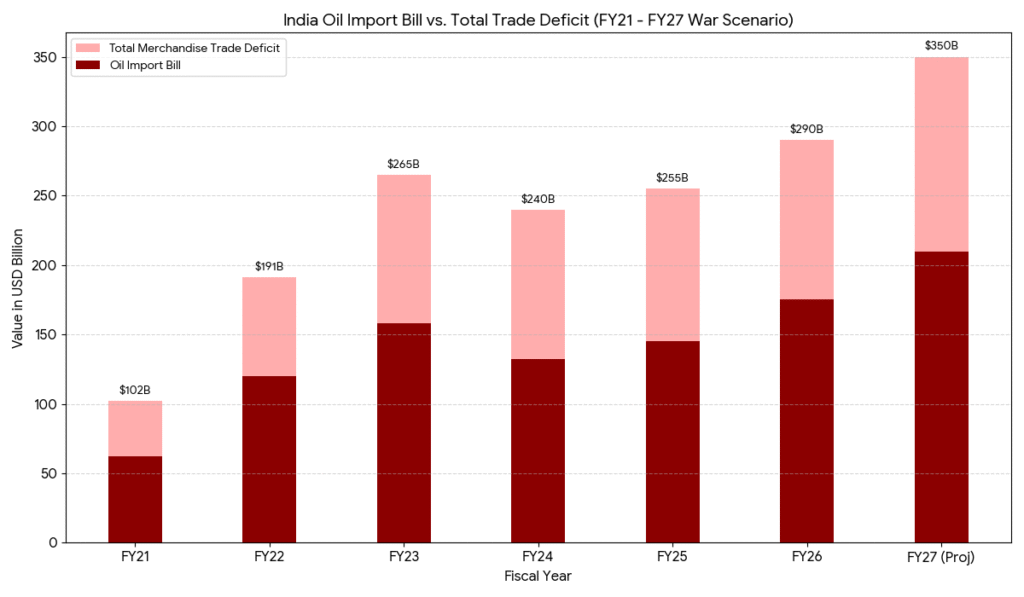
Every $10 rise in Brent crude adds $13–14 billion to India’s annual oil import bill and cuts GDP growth by 20–25 basis points. At current $105/bbl (vs $70 baseline), India’s additional oil cost is approximately $45–55 billion annualised.
Oil Import Bill vs Trade Deficit
FISCAL & EXTERNAL FINANCIAL POSITION
Fiscal & Current Account Deficit — Trajectory
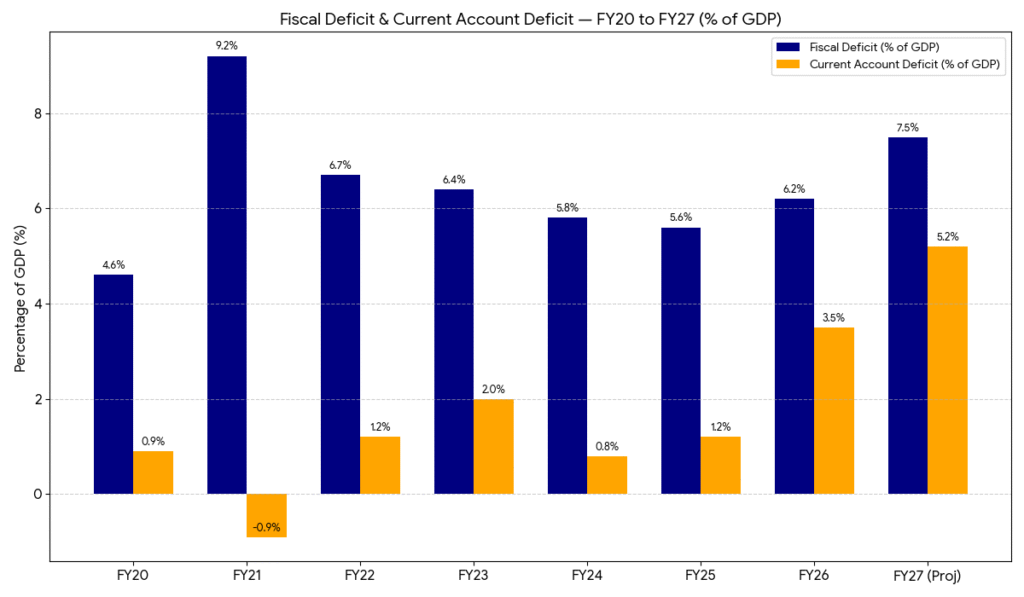
FY21 Spike: While the Fiscal Deficit was much higher in FY21 (9.2%) due to pandemic spending, the CAD was actually positive (-0.9% surplus) because global oil prices and domestic demand had collapsed.
FY27 Crisis: In contrast, the FY27 projection shows both deficits rising sharply. The Fiscal Deficit (7.5%) and the CAD (5.2%) are increasing simultaneously, creating a “twin deficit” pressure that is significantly more difficult for the economy to absorb than the pandemic spike.
Channels of Fiscal Stress
- Excise duty cut ( 10/litre petrol + diesel) → significant direct tax revenue loss ₹
- Fertilizer subsidy bill rising beyond FY27 allocation of 1.7 lakh crore ₹
- Oil Marketing Companies’ margins squeezed → lower dividend/tax flow to government
- Interest rates hardening: 10-yr bond yield at 4.46% (highest since Jul 2025)
- At oil >$100: fiscal cost of subsidies + duty cuts can exceed 1% of GD
- Rs 1 lakh crore Economic Stabilisation Fund created – unprecedented, not done during COVID or 2008 GFC
Import Stress — Oil Bill & Trade Deficit Data
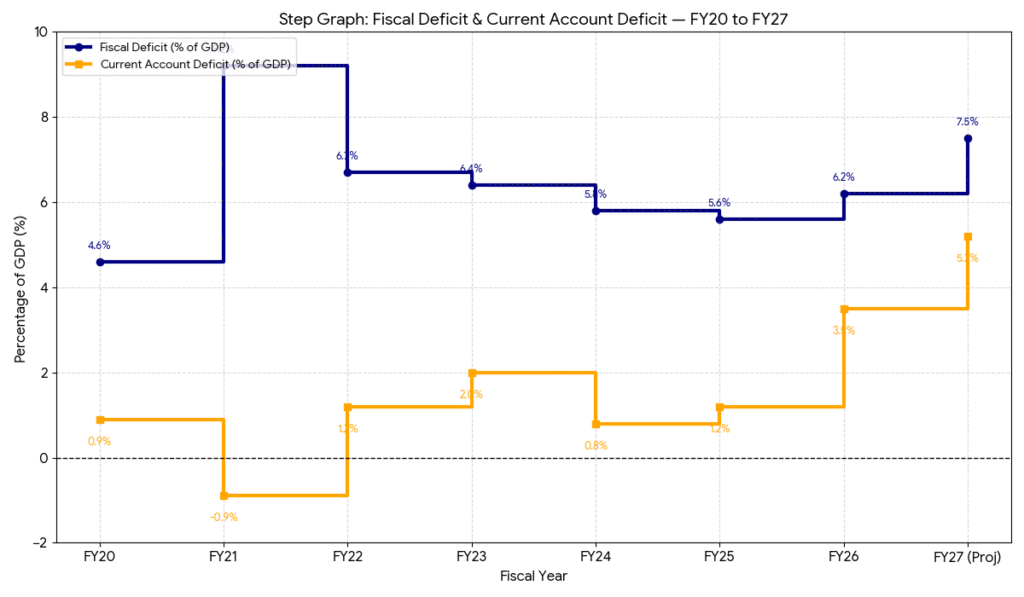
- The Stability Period (FY20–FY25): Following the massive Fiscal Deficit spike in FY21 (9.2%) due to pandemic stimulus, the government successfully steered the economy toward consolidation. By FY25, the Fiscal Deficit had narrowed to 5.6%, while the CAD remained manageable at 1.2%.
- The 2026 Deterioration: The current year (FY26) shows a notable reversal. Both deficits are climbing-Fiscal Deficit to 6.2% and CAD to 3.5%. This is primarily driven by the volatility in global oil markets following the recent disruptions in the Strait of Hormuz, which has significantly inflated the import bill.
- The FY27 “War Scenario”: The projections for next year represent a critical stress test. The CAD is expected to balloon to 5.2%, a level historically associated with extreme currency pressure. Simultaneously, the Fiscal Deficit hits 7.5%, reflecting the dual burden of high energy costs and the government’s need to buffer the economy through subsidies.
RUPEE DEPRECIATION & FOREX RESERVES
Rupee Under Pressure
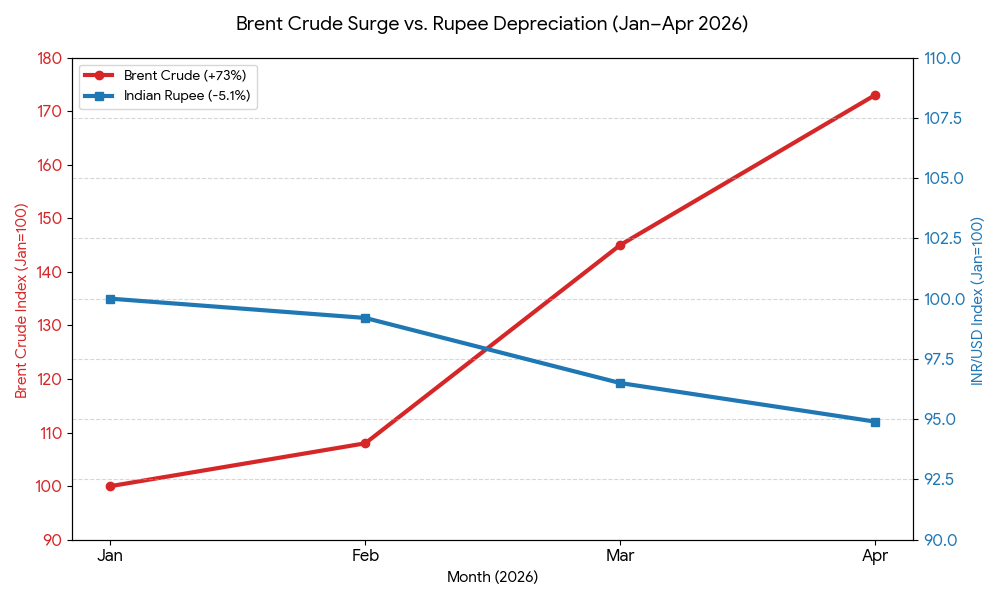
Dual Whammy – Rupee Weakness + High Crude
India pays for most key imports in USD. A weaker rupee compounds the oil price effect – India pays MORE rupees for oil that is already MORE expensive in dollars. The 2022 Ukraine war offers a precedent: CPI inflation rose to 7.79% in April 2022 with fuel & light component surging 10.8% YoY. A similar chain is now in motion.
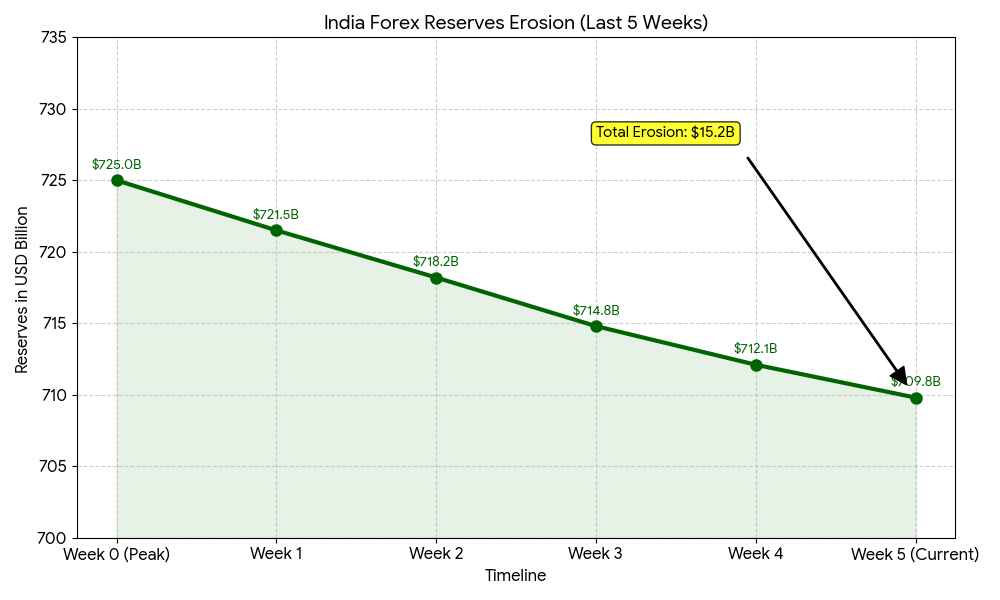
Forex Reserves Erosion Details
- Peak level (mid-February 2026): $725 billion
- Level as of March 22, 2026: $709.76 billion
- Total decline: −$18.7 billion in 5 weeks
- Week ending March 13 alone: −$7.05 billion
- RBI is selling USD continuously to defend rupee
- Still covers 11+ months of imports — providing a cushion but pace is alarming
CAPITAL MARKETS & FOREIGN INVESTMENT
FPI / FII Monthly Equity Flows
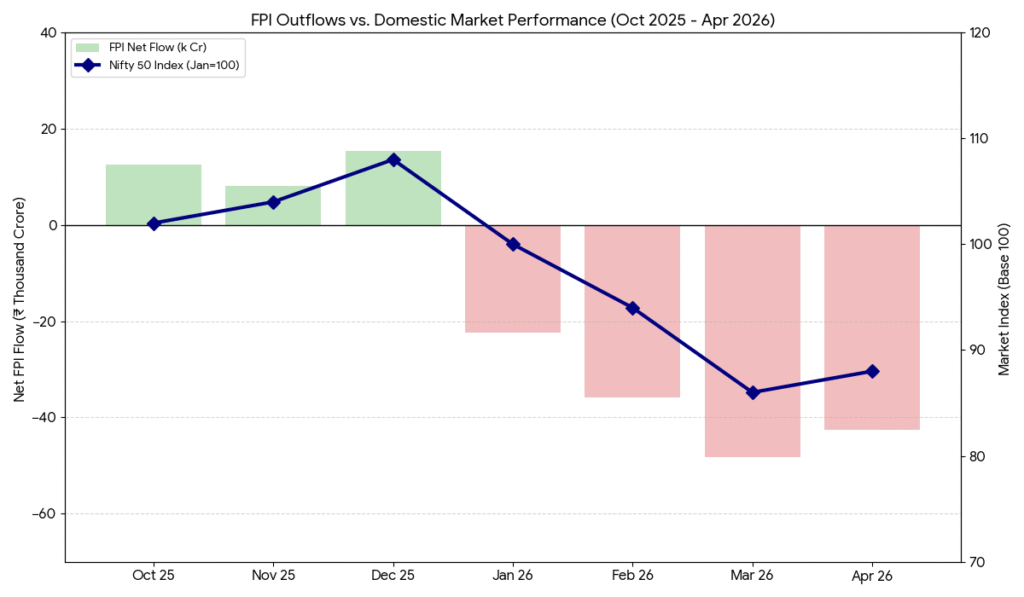
Market Dynamics Analysis
- The December Peak: At the end of 2025, FPI inflows coincided with record highs for the Nifty 50. The market index climbed to 108 (indexed to Jan 2026) as foreign capital fueled a “Santa Rally.”
- The Q1 Crash: The transition to aggressive selling in March 2026 (-₹48.2k crore) saw a direct collapse in market indices. The Nifty 50 dropped to 86, a decline of approximately 20% from its December highs. This reflects the high sensitivity of Indian blue-chip stocks to foreign sentiment.
- DII Resilience: While the market dipped significantly, it did not enter a free-fall. This is attributed to Domestic Institutional Investors (DIIs) and retail investors providing a liquidity floor, which allowed for the slight recovery seen in late April (index level 88) despite continued foreign selling.
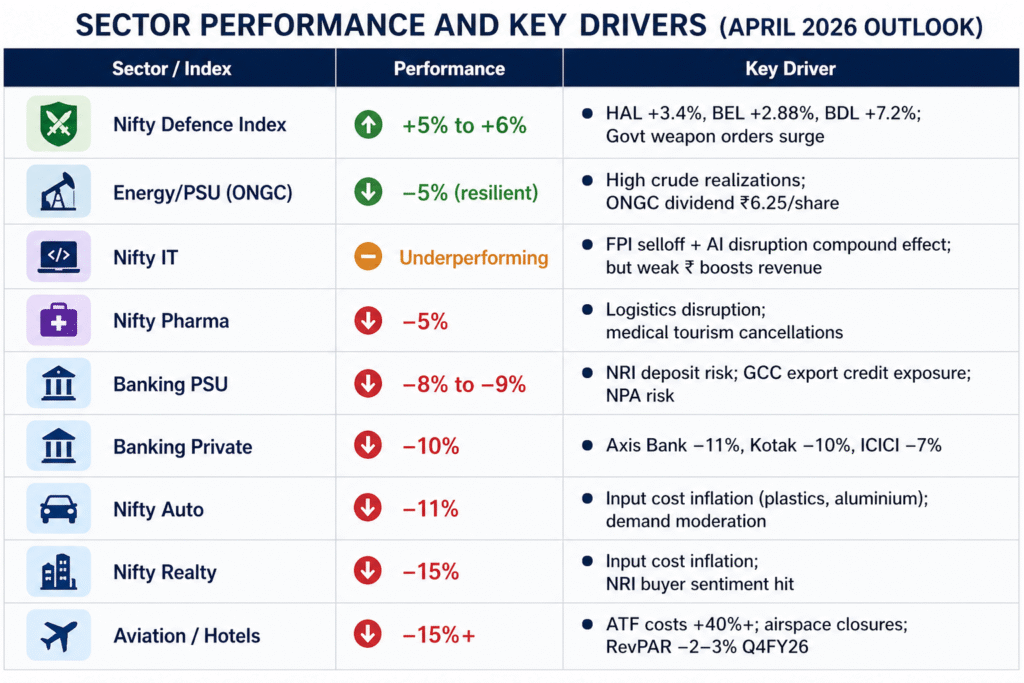
Sectoral Vulnerability
The selling has not been uniform. Sectors with the highest foreign ownership faced the most intense pressure:
- Banking & Financials: Heavily weighted in FPI portfolios, these stocks saw the sharpest corrections.
- IT Services: Often seen as a global proxy for Indian growth, the IT sector faced dual pressure from foreign exits and fears of a global slowdown.
- Energy: Ironically, while oil prices rose, local downstream companies faced margin pressure, leading to tactical selling by institutional investors.
Sectoral Stock Market Performance
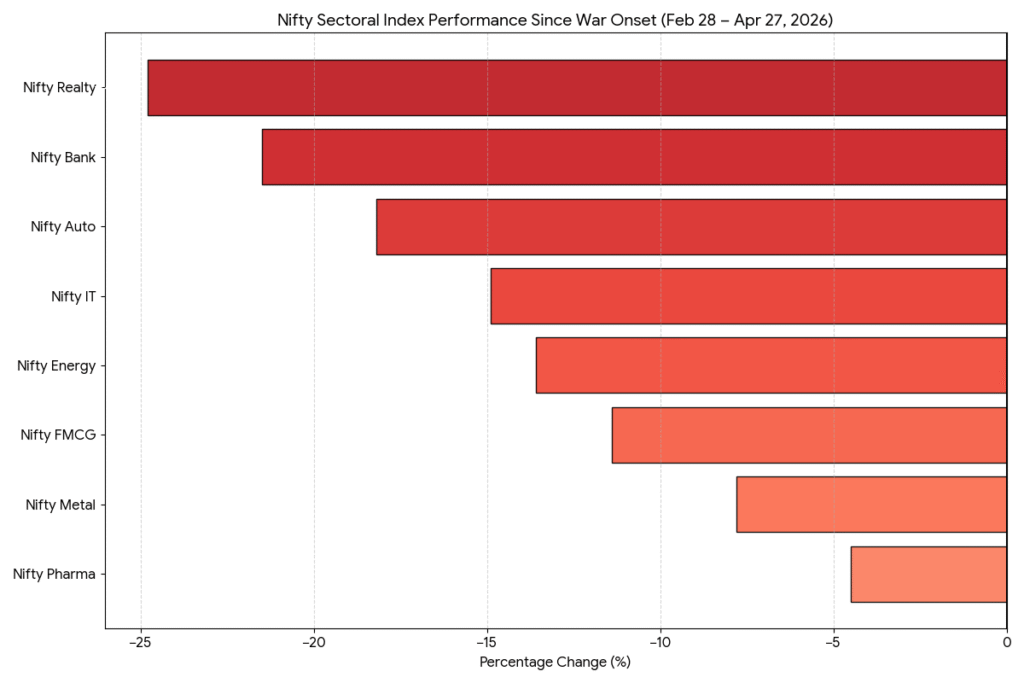
The divergence between the Nifty Realty (-24.8%) and Nifty Pharma (-4.5%) highlights a clear “risk-off” rotation. Capital is exiting high-leverage and growth-oriented sectors and seeking refuge in defensive, essential-service-oriented equities.
REMITTANCES & NRI EXPOSURE
India’s Remittance Lifeline at Risk
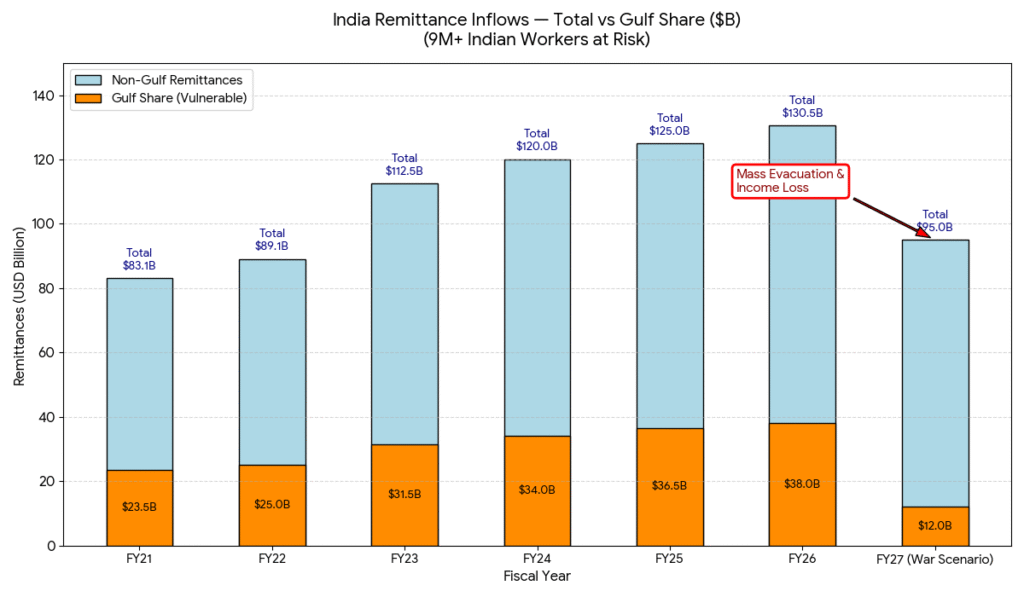
- India = world’s largest remittance recipient: ~$130-135B annually (3.5% of GDP)
- Gulf (GCC) share: ~38% = $48-51B – second only to USA as source
- 9+ million Indians work in the Gulf – in oil services, construction, hospitality, retail
- A 10% decline in Gulf remittances alone = $4-5B outflow shock to India’s BoP
- GCC also = 17% of India’s merchandise exports (gems, engineering goods, agri-products)
- UAE contributes ~20% of total India remittances; US contributes 27.7%
GDP GROWTH & INFLATION PROJECTIONS
GDP Growth — Pre-War vs War Scenarios
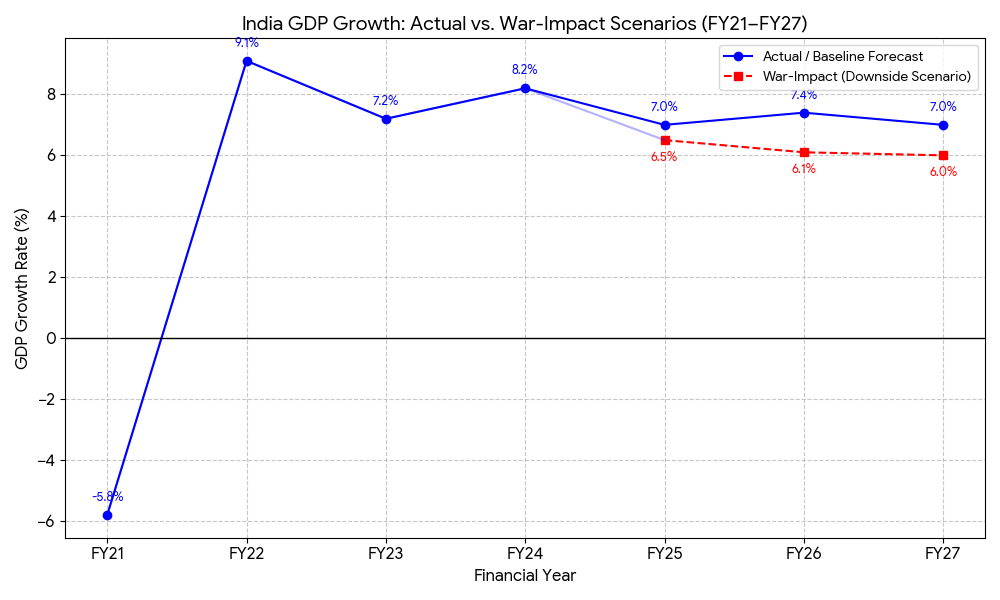
Baseline Growth: The Economic Survey 2025-26 projects a growth rate of 7.4% for FY26 and approximately 6.8-7.2% for FY27, driven by high domestic consumption and a “double engine” of private and public investment.
War-Impact (Downside): Agencies like Moody’s Ratings have slashed India’s FY27 estimates to 6.0% (from 6.8%). This is attributed to the West Asia conflict causing:
- Energy Shocks: High crude oil and LPG prices impacting household consumption.
- Trade Disruptions: Rerouting via the Cape of Good Hope increasing freight costs.
- Inflation: Potential spillovers to food prices via imported fertilizer costs.
CPI Inflation — Actual vs Scenario Projections
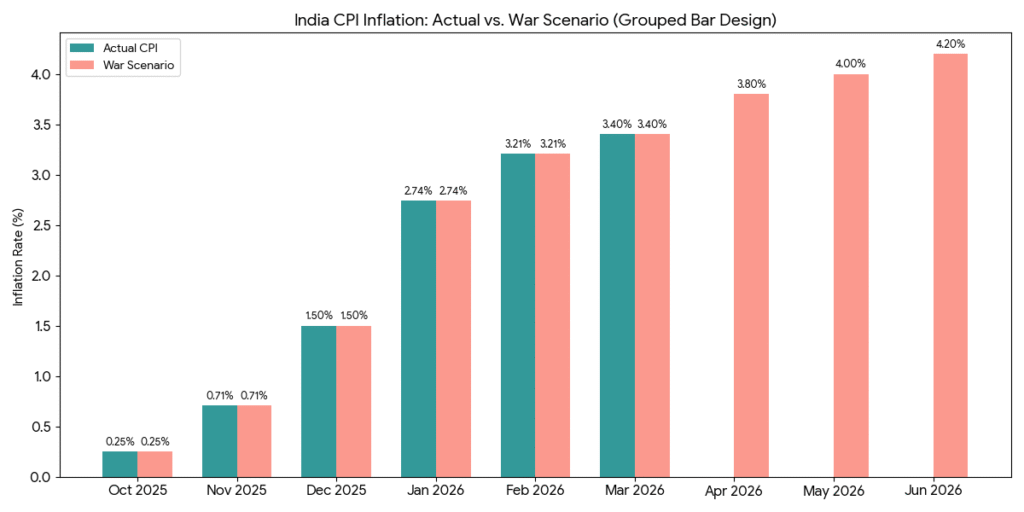
- CPI in Feb 2026: 3.21% – rising from decade-low of 1.7% in H1 FY26
- Every 10% crude rise = ~30 basis points added to CPI (Finance Ministry estimate)
- At current $105 crude vs $70 baseline (+50%): projected CPI impact = +150 bps
- Fertilizer supply disruption → weaker crop yields in 6-9 months → food price risk
- LPG shortage-driven black marketing = significant informal inflation
- Logistics & transport cost inflation rippling across all sectors
- RBI upper tolerance band: 6% – Bernstein warns this could be breached in worst case
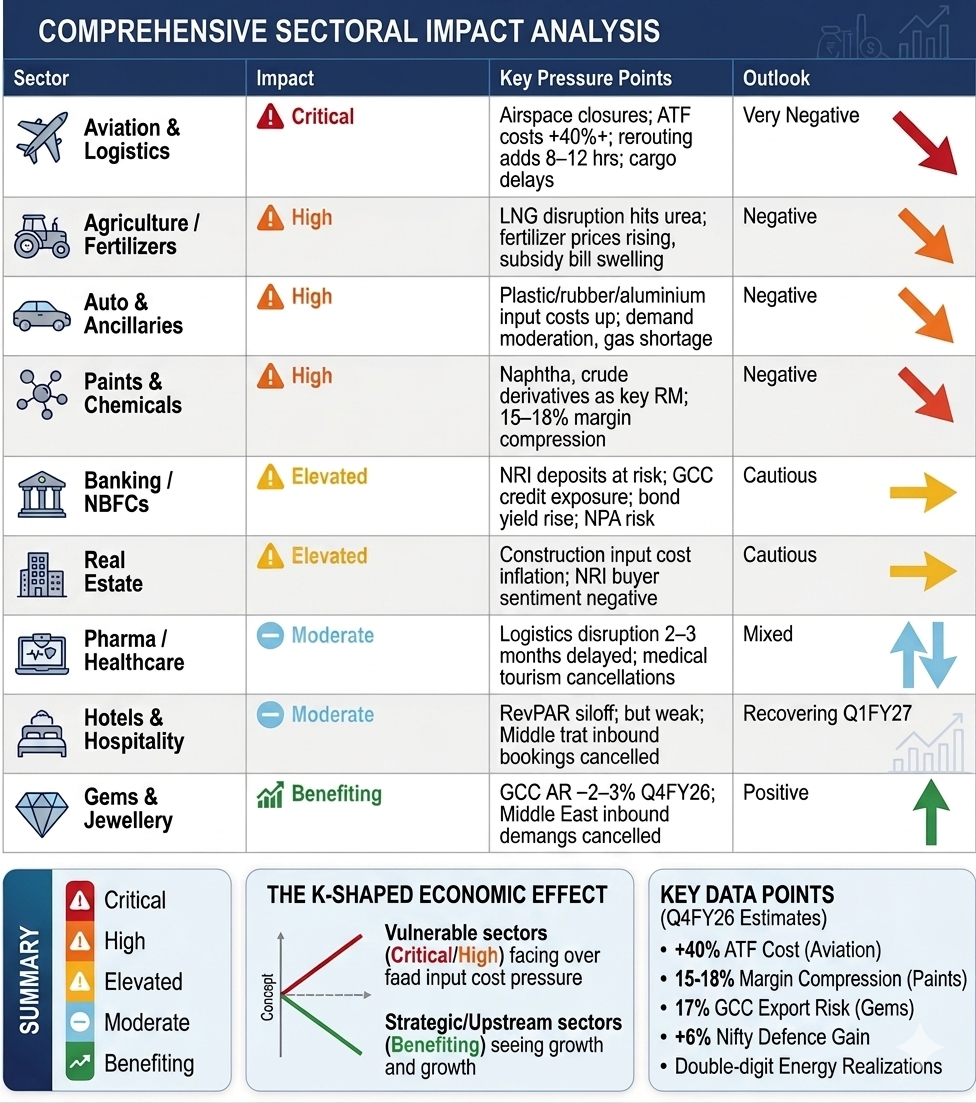
COMPREHENSIVE SECTORAL IMPACT ANALYSIS
RISK SCENARIO MATRIX — FY27 OUTLOOK
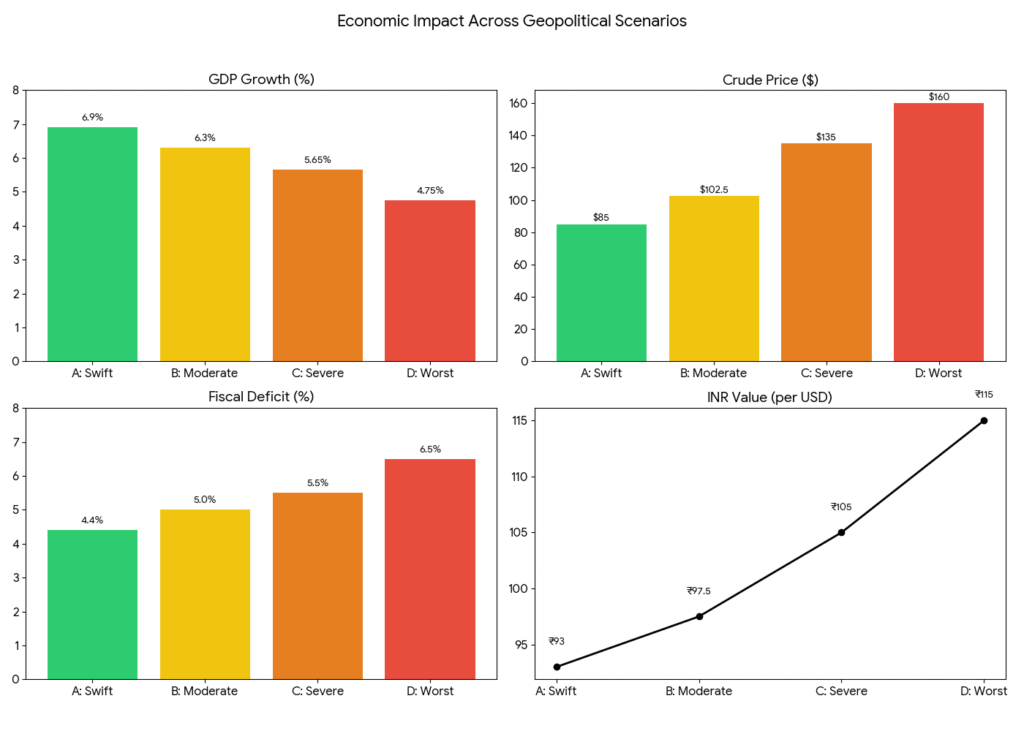
Analysis of the Progression:
- The “Kink” in the Curve: You can observe a significant jump in severity when moving from Scenario B (Moderate) to Scenario C (Severe – Hormuz blocked). The crude price leaps from ~$102 to $135, and GDP growth takes a sharper dip. This indicates that the closure of a strategic chokepoint like the Strait of Hormuz is the “tipping point” for systemic economic stress.
- Fiscal Burden: The Fiscal Deficit widening to >6% in Scenario D highlights the government’s likely need for expanded subsidy spending to protect consumers from the >$150/barrel crude prices, creating a “double-bind” scenario where the government has less fiscal room while needing to spend more.
- Currency Volatility: The depreciation of the INR to ₹115+ in the worst-case scenario reflects the combined impact of capital outflows (FPI selling) and the need for more dollars to pay for the same volume of expensive crude oil.
This graph provides a clear view of how these variables are interconnected-as the external environment (crude prices) worsens, domestic economic pillars (Growth, Fiscal health, Currency) simultaneously experience significant strain.
CHRONOLOGICAL TIMELINE — WAR & ECONOMIC IMPACT
OPPORTUNITIES AMID THE CRISIS
CONCLUSION & OUTLOOK
India is navigating one of its most complex external environments in recent memory. The 2026 Iran war created a simultaneous multi-channel shock – energy, fiscal, trade, currency, capital flows, and inflation – all triggering together. Emergency government responses (excise cuts, Economic Stabilisation Fund, forex intervention) have provided near-term cushions but cannot fully neutralise a prolonged oil shock.
India’s fundamental strengths remain intact: strong domestic demand (PFCE 61.5% of GDP), a sound of imports), a recently upgraded sovereign rating (S&P BBB), and structural reforms (labour codes, FTA pipeline, digital infrastructure). These provide significantly better shock absorption than comparable 2022 or 2008 episodes. he path forward is scenario-dependent.
A swift conflict resolution (Scenario A/B) preserves India’s growth trajectory and fiscal consolidation story. A prolonged Hormuz blockade (Scenario C/D) risks a stagflationary episode not seen since the 1970s oil shocks. Every additional week of disruption makes recovery harder. The April RBI MPC meeting, US-Iran diplomatic signals, and FPI flow direction will be the key near-term watchpoints.