
Prologue
- The company’s revenue grew from $3.1B in 2020 to $4.0B in 2024. This reflects a compound annual growth rate (CAGR) of approximately 8.9%.
- Net Profit Margin varied between 8% and 10% during the review period. Slight decline in 2022 due to higher interest and tax expenses. Stabilized in 2023 following strategic debt restructuring.
- EPS increased from $2.20 in 2020 to $2.95 in 2024. A 34% rise driven by profit growth and stable share count. This reflects strong earnings generation capacity.
Introduction
Financial statement analysis is a vital tool for understanding the economic stability and operational performance of a business. It provides key insights into how a company generates revenue, manages expenses, utilizes assets, and handles liabilities. By examining the income statement, balance sheet, and cash flow statement, stakeholders such as investors, creditors, and management can evaluate a company’s financial health and make informed decisions.
This report aims to critically review and analyze the financial statements of a company over a specific period, highlighting trends, strengths, and areas for improvement. Through ratio analysis, trend evaluation, and interpretation of key financial metrics, the analysis serves as a foundation for assessing the company’s profitability, liquidity, solvency, and overall efficiency.
Importance of Financial Statement Analysis
A major significance of financial statement analysis lies in its ability to assess a company’s overall financial health. Through key financial indicators—such as liquidity ratios, profitability margins, and solvency measures—users can understand how well a company can meet its short-term obligations, generate profit, and sustain operations in the long run.
- Informed Decision-Making: Financial statement analysis helps investors, creditors, and management make informed financial decisions. It provides a clear picture of the company’s current standing. This data supports strategic planning and resource allocation.
- Assessing Financial Health: It evaluates a company’s liquidity, profitability, and solvency. This helps determine if the business can meet its obligations and remain financially stable. It’s crucial for both internal and external stakeholders.
- Identifying Strengths and Weaknesses: Analysis reveals operational efficiency, cost management, and areas of concern. It helps management focus on strengths and correct weaknesses. This improves overall performance and competitiveness.
- Facilitating Comparisons: It enables comparison with competitors and industry benchmarks. Vertical and horizontal analysis standardize financial data for better insight. This helps assess relative performance and market position.
- Financial Planning and Forecasting: Historical data supports budgeting and future projections. It helps in setting achievable financial goals. Businesses use it to prepare for risks and opportunities.
- Supporting Investment Analysis: Investors use ratios like ROE, EPS, and P/E to assess potential returns. It aids in deciding where and when to invest. Proper analysis reduces investment risk.
- Aiding Credit Evaluation: Lenders analyze financials to assess repayment capacity. Ratios like debt-to- equity and interest coverage are key. It helps in determining loan approval and terms.
Key Components of Financial Statement Analysis
Financial statement analysis involves assessing a company’s financial health using key components that provide insights into its performance, efficiency, profitability, and stability. Here are the core components involved:
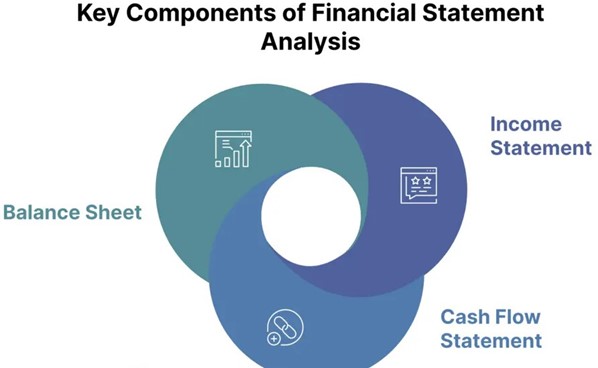
1. Income Statement (Profit and Loss Statement)
The Income Statement, also known as the Profit and Loss Statement, is a key financial document that summarizes a company’s revenues, expenses, and profits over a specific period—typically quarterly or annually. It shows how much income the company generated from its core operations and how much it spent to earn that income. Key elements of the income statement include total revenue, cost of goods sold (COGS), gross profit, operating expenses, operating income (EBIT), and net income.
This statement helps stakeholders evaluate the company’s profitability, operational efficiency, and overall financial performance during the reporting period. By comparing income statements across periods, analysts can assess trends in revenue growth, cost management, and profit margins. Key components include:
- Revenue/Sales: The total amount of money earned from core business activities.
- Gross Profit: Revenue minus the cost of goods sold (COGS).
- Operating Profit (EBIT): Earnings before interest and taxes.
- Net Income: The company’s total profit after all expenses, taxes, and interest.
Example Analysis:
- Revenue has grown at a CAGR of 7% over 5 years, indicating strong market presence.
- Gross margin stable at ~42%, suggesting effective cost management.
- Net profit margin dropped from 12% to 9% due to rising SG&A and interest expense.
2. Balance Sheet
The Balance Sheet is a fundamental financial statement that provides a snapshot of a company’s financial position at a specific point in time. It outlines what the company owns (assets), what it owes (liabilities), and the residual interest belonging to shareholders (equity). The balance sheet follows the basic accounting equation: Assets = Liabilities + Shareholders’ Equity.
Assets may include current items like cash, accounts receivable, and inventory, as well as non-current assets like property and equipment. Liabilities are categorized as current (due within a year) and long-term obligations, such as loans or bonds. Equity represents the owners’ claim after all debts are settled. This statement is crucial for assessing a company’s liquidity, capital structure, and long-term financial stability. The fundamental equation is:
- Assets = Liabilities + Equity
- Assets: Resources owned by the company (e.g., cash, property, inventory).
- Liabilities: Obligations the company owes (e.g., loans, accounts payable).
- Shareholders’ Equity: The residual interest in assets after liabilities are deducted (e.g., common stock, retained earnings).
3. Cash Flow Statement
The Cash Flow Statement provides a detailed account of the cash inflows and outflows of a company over a specific period. It is divided into three main sections: operating activities, investing activities, and financing activities. Cash flows from operating activities reflect the cash generated or used in the core business operations, such as cash received from sales or paid to suppliers. Investing activities include cash spent on or received from the purchase and sale of long-term assets like equipment or investments. Financing activities capture cash movements related to debt, equity, and dividends—such as issuing shares or repaying loans. This statement is essential for assessing a company’s liquidity, cash management, and ability to fund operations and growth without relying on external financing.
The Cash Flow Statement shows how cash moves in and out of a company, categorizing it into three areas:
- Operating Activities: Cash generated or used by day-to-day business operations.
- Investing Activities: Cash used for or generated from buying and selling assets like property, equipment, or securities.
- Financing Activities: Cash flows related to borrowing, repaying debts, or issuing stock.
How to Analyze Financial Statements
Analyzing financial statements involves evaluating a company’s financial data to understand its performance, financial health, and potential risks. This process helps investors, creditors, and management make informed decisions. The analysis typically covers three core financial statements: the Income Statement, Balance Sheet, and Cash Flow Statement, using several techniques and tools to interpret the numbers meaningfully. Here’s a step-by-step breakdown of how to analyze them:
1. Comparative Financial Statements:
This tool involves comparing financial data from two or more periods. By placing the financial statements side-by-side, users can observe changes in key items like revenue, expenses, and net income over time. It helps identify trends, patterns, and growth or decline in performance.
Purpose: To analyze year-over-year or period-over-period changes in financial performance.
Example: Comparing sales and profit from 2023 and 2024 to assess growth.
2. Trend Analysis (Horizontal Analysis)
Trend analysis tracks the movement of financial data over several accounting periods. It highlights long-term movements and growth patterns in revenues, costs, profits, and other key metrics.
Purpose: To identify financial trends over time.
Example: A steady increase in net income over five years shows positive growth.
3. Common-Size Statements
Common-size analysis expresses each item in a financial statement as a percentage of a base figure:
- In the income statement, all items are expressed as a percentage of total sales.
- In the balance sheet, items are expressed as a percentage of total assets.
This helps standardize data for comparison, especially when evaluating companies of different sizes or analyzing changes within the same company over time.
Purpose: To evaluate internal structure and proportions in financial statements.
Example: Determining what percentage of total sales was spent on cost of goods sold.
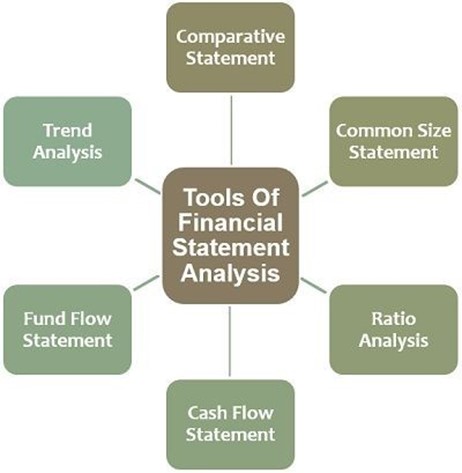
4. Ratio Analysis:
Ratio analysis is one of the most powerful tools in financial analysis. It involves computing key ratios from the financial statements to evaluate various aspects of a company’s performance.
Types of ratios include:
- Liquidity Ratios: Current Ratio, Quick Ratio
- Profitability Ratios: Gross Profit Margin, Return on Equity (ROE)
- Solvency Ratios: Debt-to-Equity Ratio, Interest Coverage Ratio
- Efficiency Ratios: Inventory Turnover, Asset Turnover
- Market Value Ratios: Earnings Per Share (EPS), Price-to-Earnings (P/E) Ratio
Purpose: To measure financial strength, performance, and operational efficiency.
Example: A high current ratio indicates strong liquidity.
5. Cash Flow Analysis:
This involves analyzing the Cash Flow Statement to assess how effectively a company generates and uses cash. The three categories of cash flows—operating, investing, and financing—reveal the company’s cash health and ability to sustain operations, grow, and meet obligations.
Purpose: To evaluate liquidity and real-time financial strength.
Example: Positive cash flow from operations shows a healthy business.
6. Fund Flow Analysis:
Fund flow analysis focuses on changes in the financial position between two balance sheet dates. It examines the movement of working capital and how funds have been sourced and used.
Purpose: To understand long-term financial planning and capital structure.
Example: Identifying how much capital was raised and where it was invested.
Financial Statement Trend Analysis (2020-2024)
Revenue growth is a key indicator of a company’s financial performance and is often the starting point in financial statement analysis. It reflects the increase or decrease in a company’s sales over a given period, typically year-over-year or quarter-over-quarter. By analyzing revenue growth, stakeholders can assess whether a company is expanding its market presence, attracting more customers, or improving its sales strategy.
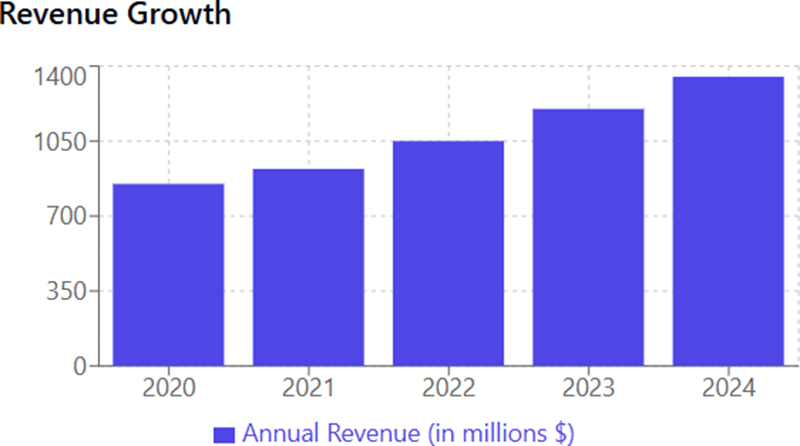
Key observations:
- Consistent Upward Trend: Revenue has shown steady growth each year, increasing from $850M in 2020 to $1,350M in 2024.
- Accelerating Growth Rate: The pace of growth appears to be increasing, with larger annual increments in later years (especially 2022-2024).
- Total Growth: Approximately 59% revenue increase over the 5-year period.
Debt and Efficiency Metrics
Debt metrics assess a company’s reliance on borrowed funds and its ability to meet long-term obligations. Key ratios include the Debt-to-Equity Ratio, which shows the proportion of debt to equity, and the Interest Coverage Ratio, which measures the company’s ability to pay interest from its earnings. These metrics help evaluate financial risk and capital structure.
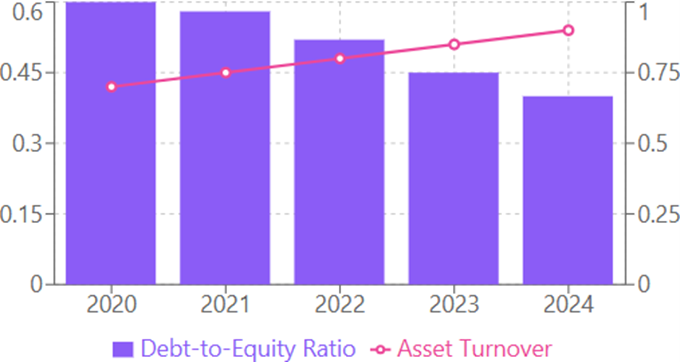
- Decreasing Leverage: Debt-to-equity ratio declined steadily from 0.6 to 0.4 (33% reduction)
- Improved Asset Utilization: Asset turnover increased from 0.7 to 0.9, demonstrating better efficiency in generating revenue from assets
- Complementary Trends: Lower debt alongside higher efficiency suggests improved financial management.
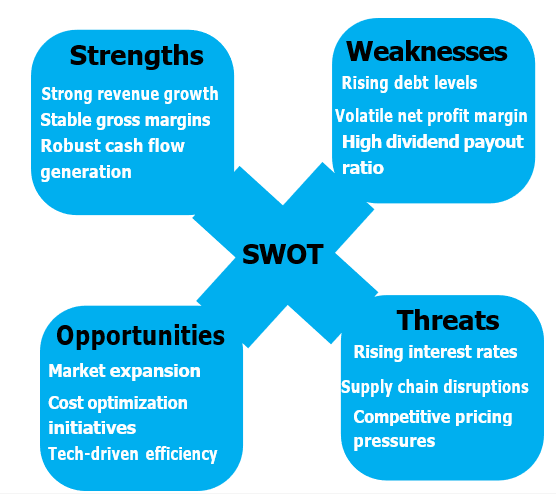
SWOT Based on Financials
Conclusion
A thorough analysis of a company’s financial statements provides valuable insights into its overall financial health, operational efficiency, and long-term sustainability. By examining the income statement, balance sheet, and cash flow statement, stakeholders can evaluate profitability, liquidity, solvency, and cash management. Tools such as ratio analysis, trend analysis, and common-size statements help interpret financial data effectively and support informed decision-making. Ultimately, financial statement analysis is a critical process for investors, creditors, and management to assess performance, identify potential risks, and formulate strategic plans for future growth.