
Executive summary
A listed company’s financial performance is judged on one question: does it grow, earn returns above its cost of capital, and convert those earnings into cash, without taking on undue risk? No single metric answers this. Boards, investors, lenders and rating agencies read a layered set of measures against history, peers and guidance.
Key findings
- Statements first, ratios second. Evaluation starts with audited, standardised statements (Ind AS / IFRS) published on a fixed cadence. Ratios only mean something once the numbers are clean and comparable.
- Six pillars carry the analysis: growth, profitability, efficiency, liquidity, solvency and cash flow. Strength in one rarely offsets weakness in another; credit and equity readers weigh them differently.
- Return on capital is the decisive test. Profit growth that earns less than the weighted average cost of capital (WACC) destroys value. ROIC minus WACC, and the DuPont split of ROE, show whether returns come from margins, asset use or leverage.
- Cash conversion separates quality from accounting. Persistent gaps between EBITDA and operating cash flow, rising receivable days or recurring “one-off” charges are the most common early warnings.
- Markets add a forward view. Valuation multiples and total shareholder return (TSR) reflect what investors expect. Guidance and non-GAAP metrics shape that expectation and need reconciling to reported figures.
- Governance and ESG now sit inside the evaluation. Related-party exposure, audit quality, promoter pledging and sustainability disclosures affect cost of capital and rating outcomes.
The evaluation sequence at a glance
| Step | Question | Main tools |
|---|---|---|
| 1. Source data | Are the numbers reliable and comparable? | Audited statements, notes, segment data |
| 2. Measure | What happened? | Six pillars: growth to cash flow |
| 3. Explain | Why did it happen? | DuPont, trend, peer and segment analysis |
| 4. Value | Was value created? | ROIC vs WACC, EVA, TSR, multiples |
| 5. Trust | How much can the numbers be relied on? | Earnings quality, governance, ESG |
1. Introduction and approach
This report sets out how a publicly traded company evaluates its financial performance, and how outside stakeholders evaluate it in turn. It is company-agnostic: no issuer is named, and illustrative figures are hypothetical. A listed company answers to several audiences at once, and each reads the same numbers for a different decision.
| Stakeholder | Core question | Metrics they lean on |
|---|---|---|
| Board and management | Are we meeting plan and creating value? | Budget vs actual, segment margins, ROIC, KPIs |
| Equity investors | Will earnings and cash per share compound? | EPS growth, ROE, free cash flow, P/E, EV/EBITDA, TSR |
| Lenders and bondholders | Can the company service and repay debt? | Net debt/EBITDA, interest cover, DSCR, liquidity |
| Rating agencies | How likely is default across a cycle? | Leverage, coverage, cash flow stability, business risk |
| Regulators and auditors | Are disclosures true, fair and timely? | Compliance, accounting policies, related-party flows |
The report follows the sequence an analyst uses in practice: check the source data, measure performance across six pillars, decompose results with analytical tools, test value creation, review governance and earnings quality, then flag red flags and implications for Blucrest.
2. The reporting framework
Evaluation rests on standardised, audited disclosure released on a fixed timetable. In India, listed entities report under Ind AS (converged with IFRS) and SEBI’s Listing Obligations and Disclosure Requirements (LODR) Regulations; global peers follow IFRS or US GAAP.
| Statement | What it shows | Key evaluation use |
|---|---|---|
| Profit and loss | Revenue, costs and profit over a period | Growth, margins, EPS |
| Balance sheet | Assets, liabilities and equity at a date | Leverage, liquidity, capital employed |
| Cash flow statement | Operating, investing and financing cash flows | Cash conversion, free cash flow, funding needs |
| Changes in equity | Reserves, dividends, buybacks | Capital allocation, payout policy |
Notes to accounts carry as much weight as the statements: accounting policies, segment data (Ind AS 108), contingent liabilities, related-party transactions, leases and borrowing terms.
Reporting cadence (SEBI LODR)
- Quarterly results within 45 days, with auditor limited review.
- Annual audited results within 60 days of year end.
- Continuous disclosure of material events, rating changes and defaults.
- BRSR sustainability report for the top 1,000 listed companies.
Consolidated vs standalone
Analysts generally evaluate consolidated figures, since subsidiaries carry much of the debt and operations. Standalone accounts matter for holding-company structures, where parent-level cash flows service parent-level debt.
3. Core evaluation pillars
Six pillars cover the full picture; each answers a distinct question and none substitutes for another. Indicative ranges are general rules of thumb and vary widely by sector.
| Pillar | Question it answers | Key metrics | What “good” typically looks like |
|---|---|---|---|
| Growth | Is the business getting bigger, and why? | Revenue growth (volume vs price), EBITDA and PAT growth, EPS CAGR | Growth ahead of the industry, led by volume and mix rather than one-off price |
| Profitability | How much of each rupee of sales is kept? | Gross, EBITDA, EBIT and net margins; ROE; ROCE | Stable or expanding margins through the cycle |
| Efficiency | How hard do assets and working capital work? | Asset turnover; inventory, receivable and payable days; cash conversion cycle | Turnover rising; cash conversion cycle stable or shortening |
| Liquidity | Can near-term obligations be met? | Current ratio, quick ratio, cash and undrawn lines vs 12-month maturities | Liquidity covers at least the next 12 months of maturities |
| Solvency | Is the capital structure sustainable? | Debt/equity, net debt/EBITDA, interest coverage, DSCR | Net debt/EBITDA comfortably below sector norms; coverage well above 3x |
| Cash flow | Do profits turn into cash? | Operating cash flow, OCF/EBITDA, free cash flow, FCF yield | OCF/EBITDA consistently above roughly 70–80% |
How the pillars interact
Growth vs cash. Rapid growth often absorbs working capital and capex, so free cash flow can lag profit. The question is whether the growth is funded sustainably.
Profitability vs solvency. High ROE can be manufactured by leverage. The DuPont split (section 4) shows whether returns come from operations or the balance sheet.
Liquidity vs efficiency. Excess cash flatters liquidity but drags on returns; tight working capital boosts returns but raises refinancing sensitivity.
Equity and credit lenses differ
| Lens | Prioritises | Penalises most |
|---|---|---|
| Equity investor | Growth, ROE, EPS compounding, free cash flow per share | Slowing growth, falling returns, dilution |
| Lender / rating agency | Solvency, liquidity, stability of cash flow, covenant headroom | Volatility, rising leverage, refinancing concentration |
Analyst’s rule: read the pillars together. A company that scores well on growth and profitability but poorly on cash flow and solvency is usually funding its growth with debt, and that is the profile most likely to face a rating downgrade when conditions tighten.
4. Analytical tools
Ratios become insight only when compared: against the company’s own history, its peers, its plan, and across its segments. Ratio analysis computes the pillar metrics consistently each period, using average balances for return ratios and trailing-twelve-month figures for quarterly comparisons.
DuPont decomposition
ROE = (Net profit ÷ Revenue) × (Revenue ÷ Average assets) × (Average assets ÷ Average equity)
Net profit margin × Asset turnover × Equity multiplier
Net profit margin × Asset turnover × Equity multiplier
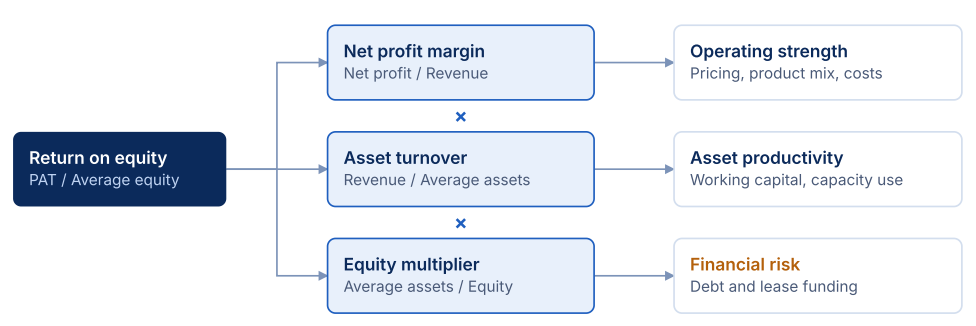
Returns driven by the top two branches are durable; returns driven mainly by the equity multiplier rise and fall with debt. Two companies with the same 18% ROE can differ sharply: one with a 12% margin and low leverage, another with a 4% margin propped up by a geared balance sheet.
Trend and common-size
Trend analysis tracks each line over 5–10 years or 8–12 quarters. Common-size analysis shows each P&L line as a % of revenue and each balance-sheet line as a % of assets, exposing shifts in cost structure.
Peer and segment analysis
Peers must share business model and accounting basis, adjusted for leases and capitalisation. Segment data (Ind AS 108) shows which businesses fund the group and which consume capital.
Example: reading the same year two ways (hypothetical)
| Metric | Year 1 | Year 2 | Reading |
|---|---|---|---|
| Revenue growth | 14% | 18% | Faster growth |
| EBITDA margin | 16.0% | 14.5% | Growth bought with price or mix |
| Receivable days | 52 | 68 | Looser credit terms |
| OCF / EBITDA | 82% | 58% | Earnings not converting to cash |
| Net debt / EBITDA | 1.6x | 2.3x | Working capital funded by debt |
The headline (growth up) and the analysis (quality down) point in opposite directions. This is the pattern ratio and trend work is designed to catch.
5. Value creation and market-based measures
A company creates value only when its return on invested capital exceeds its cost of capital; accounting profit alone does not prove this.
ROIC = EBIT × (1 tax rate) ÷ (Debt + Equity Cash)
Value is created when ROIC exceeds WACC · EVA = NOPAT (WACC × invested capital)
A positive, stable ROIC–WACC spread applied to a growing capital base compounds shareholder value. A negative spread means growth destroys value: the faster such a company grows, the worse the outcome. EVA turns the spread into a rupee figure, which is why some boards use it in incentive plans.
| Market measure | What it captures | Read with care when |
|---|---|---|
| TSR | Share price change plus dividends | Short windows; market-wide moves dominate |
| P/E | Price paid per rupee of earnings | Earnings are cyclical or include one-offs |
| EV/EBITDA | Enterprise value vs operating cash earnings | Capex or lease intensity differs across peers |
| Price-to-book | Market value vs book equity | Asset-light firms; key for banks and NBFCs |
| FCF yield | Free cash flow vs market value | Capex is temporarily low or high |
Multiples show whether the market prices a company richly or cheaply against peers; a DCF tests whether that price is justified by expected cash flows. Robust evaluations use both and explain the gap.
6. The management view: plans, KPIs and guidance
Internally, performance is judged against the company’s own plan before the market. Actuals are compared with budget and prior year each month or quarter, and variances split into volume, price and mix, cost, and external factors (currency, commodities, rates). Rolling 12–18 month forecasts increasingly replace a static budget.
| Business model | Typical operating KPIs |
|---|---|
| Retail | Same-store sales growth, revenue per sq ft, inventory turns |
| Manufacturing | Capacity utilisation, EBITDA per tonne or unit, order book |
| Technology / SaaS | Annual recurring revenue, net revenue retention, customer acquisition cost |
| Banks and NBFCs | Net interest margin, cost-to-income, gross and net NPA, capital adequacy |
Guidance
Delivery against guidance becomes a performance measure in itself: repeated misses raise the market’s risk premium even when absolute results are respectable.
Non-GAAP measures
Adjusted EBITDA and “underlying” profit can clarify trends, but must be reconciled to reported figures. Analysts check whether “exceptional” items recur.
7. Governance, ESG and quality of earnings
The same reported profit can deserve very different valuations and ratings depending on how reliable it is and how the company is run.
Quality of earnings
- Accruals: a widening gap between profit and operating cash flow.
- Revenue recognition: channel stuffing or quarter-end bunching.
- Capitalisation: costs moved from the P&L to the balance sheet.
- Exceptional items: “one-offs” that recur, or gains that flatter profit.
- Auditor signals: qualifications, emphasis of matter, resignations.
Governance
- Board independence and audit committee effectiveness.
- Related-party transactions: size, pricing, approval.
- Promoter share pledging, a sign of funding stress.
- Capital allocation record: acquisitions, payouts, group loans.
- Consistency and timeliness of disclosure.
ESG. Lenders link pricing to sustainability targets, investors screen on ESG scores, and rating agencies assess ESG where it is material to credit, such as carbon transition risk in heavy industry. In India, BRSR standardises these disclosures for large listed companies.
8. Limitations and red flags
Statement analysis is backward-looking and shaped by accounting choices (depreciation, Ind AS 116 leases, revenue timing). Peers differ in mix and year-end, inflation can mask flat volumes, and intangibles such as brands and data are largely off the balance sheet.
Red flags
| Red flag | Why it matters |
|---|---|
| Profit rising while operating cash flow falls | Earnings may not be real or sustainable |
| Receivable or inventory days rising faster than sales | Channel stuffing, weak collections or obsolete stock |
| Recurring “exceptional” charges | Underlying costs are being hidden |
| Debt rising with no matching rise in earnings | Losses or leakage being funded |
| Large or growing related-party transactions | Value may be moving out of the listed entity |
| Rising promoter pledge | Forced selling risk; group funding stress |
| Frequent changes in auditor, CFO or accounting policy | Weak controls or disputes over numbers |
| Short-term debt funding long-term assets | Refinancing risk if credit tightens |
| Repeated misses against guidance | Weak forecasting or a deteriorating business |
One flag in isolation may have an innocent explanation. Several together usually precede a rating downgrade or a sharp de-rating of the stock.
9. Conclusion
Evaluating a listed company’s performance is a layered judgement: clean statements first, the six pillars to measure, analytical tools to explain, ROIC versus WACC to test value creation, and governance to decide how far the numbers can be trusted. Companies that score well fund growth sustainably, earn above their cost of capital through the cycle, and turn profit into cash. For Blucrest, this is the lens lenders and agencies will apply to every client.
Appendix: key ratios
| Ratio | Formula | Ratio | Formula |
|---|---|---|---|
| ROE | PAT / Avg equity | Net debt / EBITDA | (Debt − Cash) / EBITDA |
| ROCE | EBIT / (Assets − Current liabilities) | Interest coverage | EBIT / Interest expense |
| ROIC | NOPAT / (Debt + Equity − Cash) | DSCR | (PAT + D&A + Interest) / Debt service |
| Cash conversion cycle | Inventory + Receivable − Payable days | OCF / EBITDA | Operating cash flow / EBITDA |
| Current ratio | Current assets / Current liabilities | EV / EBITDA | (Market cap + Net debt) / EBITDA |
Regulatory references reflect Indian requirements (Ind AS, SEBI LODR, BRSR) as generally understood; ranges are indicative and sector dependent. Verify current thresholds before citing externallly